
Infographics have become a powerful tool for presenting complex information in a visually engaging and easily digestible format. Whether for business presentations, educational materials, or social media content, creating compelling infographics requires the right tools. Fortunately, there are numerous platforms available that cater to both beginners and professionals, offering a range of features to simplify the design process. From drag-and-drop interfaces to customizable templates, these tools empower users to craft stunning visuals without needing advanced design skills. This article explores some of the best tools for creating infographics, highlighting their unique features and helping you choose the right one for your needs.
Any Good Tools for Creating Infographics?
1. What Are the Best Tools for Creating Infographics?
Creating infographics has become easier with the availability of various online tools. Some of the best tools include Canva, Piktochart, Venngage, Visme, and Adobe Spark. These platforms offer user-friendly interfaces, pre-designed templates, and customization options to help users create visually appealing infographics without needing advanced design skills.
See Also? 3") Seeking Recommendations: Customer Data Platform (CDP)?
Seeking Recommendations: Customer Data Platform (CDP)?2. Why Use Canva for Infographics?
Canva is one of the most popular tools for creating infographics due to its intuitive drag-and-drop interface and a vast library of templates, icons, and fonts. It is ideal for beginners and professionals alike, offering both free and premium features. Canva also allows collaboration, making it a great choice for teams working on projects together.
3. How Does Piktochart Stand Out?
Piktochart is another excellent tool for infographic creation, known for its specialized templates tailored for different industries. It provides data visualization tools, such as charts and maps, which are perfect for presenting complex information in a simple and engaging way. Piktochart also supports custom branding, allowing users to incorporate their logos and color schemes.
See Also Which Social Media Platform Is the Easiest for a Complete Newbie to Grow On?
4. What Makes Venngage a Great Choice?
Venngage is a versatile tool that offers a wide range of infographic templates, including options for reports, presentations, and social media posts. It stands out for its interactive features, such as clickable links and animations, which can enhance user engagement. Venngage also provides analytics to track the performance of your infographics.
5. Is Adobe Spark Suitable for Beginners?
Adobe Spark is a powerful tool that combines simplicity with professional-grade features. It is suitable for beginners due to its easy-to-use interface and step-by-step guidance. Adobe Spark also integrates seamlessly with other Adobe products, making it a great choice for users already familiar with the Adobe ecosystem.
See Also Any Regrets in Pursuing Marketing (Digital Marketing Specifically)?
| Tool | Key Features | Best For |
|---|---|---|
| Canva | Drag-and-drop interface, templates, collaboration | Beginners and teams |
| Piktochart | Industry-specific templates, data visualization | Data-heavy infographics |
| Venngage | Interactive features, analytics | Engaging and trackable content |
| Adobe Spark | Professional features, Adobe integration | Beginners and Adobe users |
| Visme | Custom animations, multimedia support | Dynamic and interactive infographics |
Can ChatGPT create infographics?
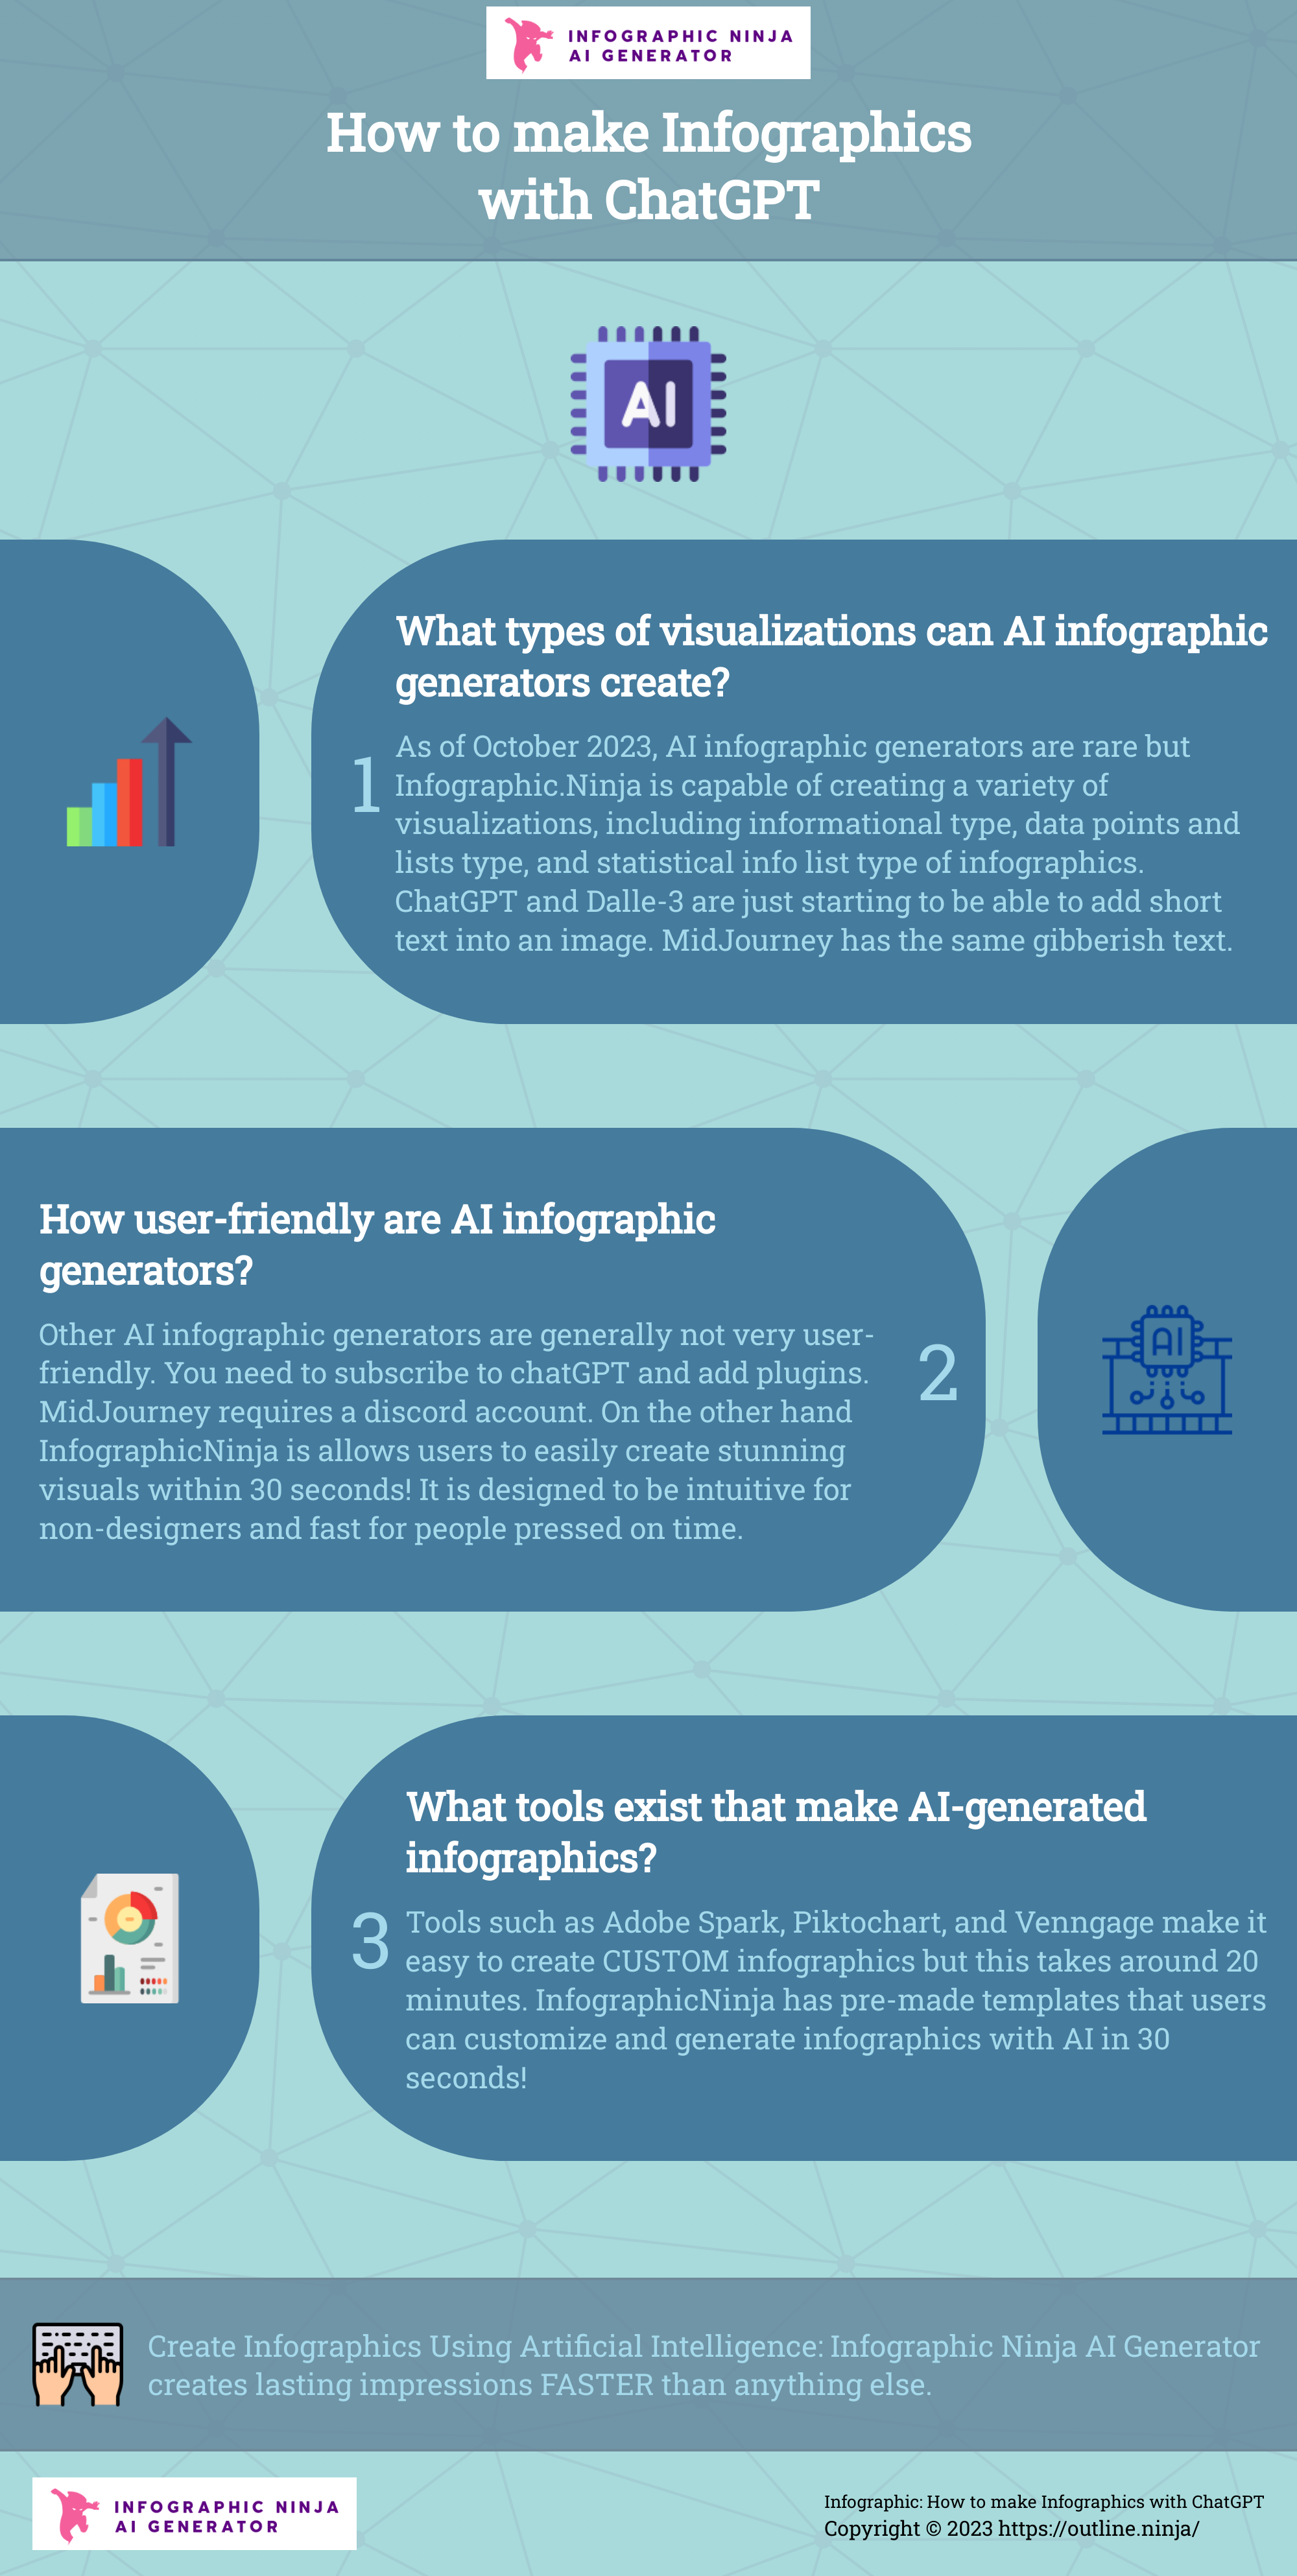
Can ChatGPT Directly Create Infographics?
No, ChatGPT cannot directly create infographics as it is a text-based AI model. However, it can assist in generating the content and ideas needed for an infographic. Here’s how:
- Content Generation: ChatGPT can provide the text, statistics, and key points required for an infographic.
- Structure Suggestions: It can suggest layouts, sections, and visual hierarchies to organize the information effectively.
- Design Ideas: While it cannot design visuals, it can recommend color schemes, fonts, and themes based on the topic.
How Can ChatGPT Assist in Infographic Creation?
ChatGPT can play a supportive role in the infographic creation process by providing the following:
- Data Compilation: It can gather and summarize data from various sources to ensure accuracy.
- Text Summarization: It can condense lengthy information into concise, impactful text suitable for infographics.
- Creative Input: It can brainstorm ideas for visual metaphors or analogies to make the infographic more engaging.
What Tools Can Be Used Alongside ChatGPT for Infographics?
To create infographics, ChatGPT can be paired with specialized tools. Here are some options:
- Canva: A user-friendly design tool with templates for infographics.
- Piktochart: A platform specifically designed for creating infographics and visual content.
- Adobe Illustrator: A professional tool for custom and high-quality infographic designs.
What Are the Limitations of ChatGPT in Infographic Creation?
While ChatGPT is a powerful tool, it has certain limitations when it comes to infographic creation:
- No Visual Output: It cannot generate images, charts, or graphics directly.
- Dependence on External Tools: It requires collaboration with design software to produce the final infographic.
- Limited Design Expertise: Its design suggestions are based on text analysis, not visual design principles.
How to Maximize ChatGPT’s Role in Infographic Projects?
To fully leverage ChatGPT’s capabilities in infographic projects, follow these steps:
- Define the Objective: Clearly outline the purpose and target audience of the infographic.
- Use ChatGPT for Research: Gather and refine data, statistics, and key messages using ChatGPT.
- Collaborate with Design Tools: Combine ChatGPT’s output with design platforms to create a visually appealing infographic.
What is the best way to make an infographic?

1. Define Your Purpose and Audience
Before creating an infographic, it is essential to clearly define your purpose and understand your target audience. Ask yourself what message you want to convey and who will benefit from it. This step ensures that your infographic is both relevant and engaging.
- Identify the goal: Are you educating, promoting, or summarizing information?
- Research your audience: Understand their preferences, needs, and level of expertise.
- Tailor your content: Use language and visuals that resonate with your audience.
2. Gather and Organize Data
An effective infographic relies on accurate and well-organized data. Start by collecting reliable information from credible sources and then structure it logically to ensure clarity.
- Collect data: Use reputable sources like studies, reports, or surveys.
- Filter information: Remove unnecessary details to keep the content concise.
- Organize logically: Arrange data in a sequence that tells a compelling story.
3. Choose the Right Design Tools
Selecting the appropriate design tools is crucial for creating a professional-looking infographic. There are various tools available, ranging from beginner-friendly to advanced options.
- Beginner tools: Canva, Piktochart, or Venngage.
- Advanced tools: Adobe Illustrator or Photoshop.
- Consider features: Look for templates, icons, and customization options.
4. Focus on Visual Hierarchy and Layout
A well-designed infographic uses visual hierarchy to guide the viewer’s eye and make the information easy to digest. Pay attention to layout, spacing, and the placement of elements.
- Use headings and subheadings: Break content into sections for better readability.
- Prioritize key information: Place the most important data at the top or center.
- Balance visuals and text: Avoid overcrowding and maintain white space.
5. Incorporate Engaging Visuals and Colors
Visual elements like icons, charts, and colors play a significant role in making your infographic appealing and easy to understand. Choose visuals that complement your data and enhance the overall design.
- Use icons and illustrations: Simplify complex ideas with visuals.
- Select a cohesive color palette: Stick to 2-4 colors that align with your brand or theme.
- Add charts and graphs: Present data in a visually appealing and digestible format.
What is the best AI tool for creating infographics?

When it comes to creating infographics, Canva is often considered one of the best AI-powered tools available. It offers a user-friendly interface, a vast library of templates, and AI-driven design suggestions that make the process seamless. Other notable tools include Visme, which provides advanced customization options, and Piktochart, known for its simplicity and professional output. These tools leverage AI to streamline design workflows, making it easier for users to create visually appealing infographics without extensive design experience.
Why is Canva a top choice for infographic creation?
Canva stands out as a top choice for infographic creation due to its AI-powered design assistant, which helps users select layouts, colors, and fonts. Here are some key reasons:
- Extensive template library: Offers thousands of pre-designed templates tailored for infographics.
- Drag-and-drop functionality: Simplifies the design process for beginners and professionals alike.
- AI-driven suggestions: Provides real-time recommendations to enhance visual appeal.
What makes Visme a strong contender for infographic design?
Visme is a strong contender because of its advanced customization features and AI integration. Key highlights include:
- Interactive elements: Allows users to add animations, videos, and clickable links to infographics.
- Data visualization tools: Includes charts, graphs, and maps that are easy to customize.
- AI-powered design assistance: Helps users create professional-quality infographics quickly.
How does Piktochart simplify infographic creation?
Piktochart simplifies infographic creation by focusing on user-friendly features and AI-driven design support. Its standout features include:
- Pre-designed templates: Offers a wide range of templates for various industries and purposes.
- Intuitive editor: Makes it easy to customize designs without prior experience.
- AI-powered suggestions: Provides tips for improving layout and visual hierarchy.
Are there other AI tools worth considering for infographics?
Yes, there are several other AI tools worth considering for infographic creation. These include:
- Venngage: Known for its focus on data-driven infographics and ease of use.
- Easel.ly: Offers a simple interface and AI-powered design recommendations.
- Adobe Express: Combines Adobe's design expertise with AI tools for professional results.
What Adobe program is best for infographics?
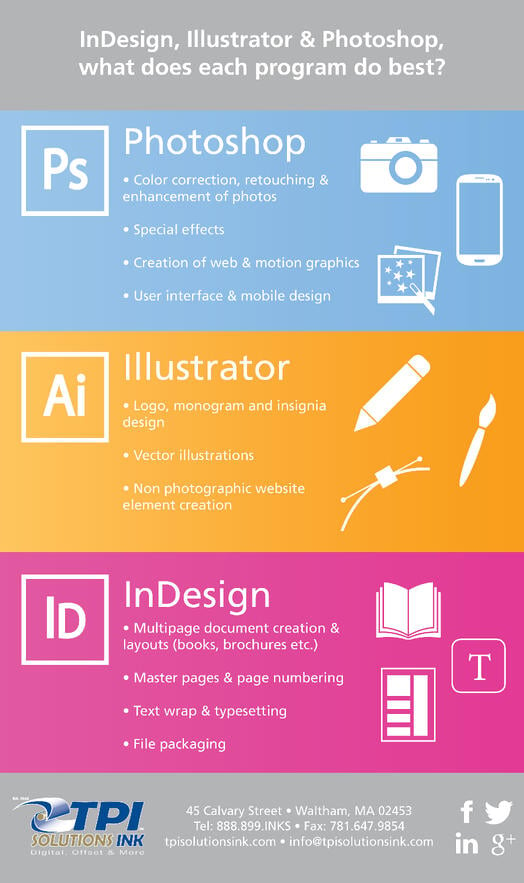
Why Adobe Illustrator is the Best Choice for Infographics
Adobe Illustrator is widely regarded as the best Adobe program for creating infographics due to its vector-based design capabilities. Unlike raster-based programs, Illustrator allows you to create scalable graphics that maintain their quality at any size. This is crucial for infographics, which often need to be resized for different platforms. Additionally, Illustrator offers:
- Precision tools for creating detailed charts, graphs, and icons.
- A wide range of templates specifically designed for infographics.
- Seamless integration with other Adobe Creative Cloud apps like Photoshop and InDesign.
Key Features of Adobe Illustrator for Infographics
Adobe Illustrator provides a suite of features tailored for infographic design. These include:
- Pen Tool: Perfect for creating custom shapes and paths.
- Graph Tools: Built-in tools for creating bar charts, pie charts, and more.
- Typography Options: Advanced text formatting to make your infographics visually appealing.
How Adobe Photoshop Complements Illustrator for Infographics
While Illustrator is the primary tool, Adobe Photoshop can be used to enhance infographics by:
- Editing raster images that may be included in the design.
- Adding textures and effects to make the infographic more engaging.
- Retouching photos to ensure they align with the overall design.
Adobe InDesign for Multi-Page Infographics
For multi-page infographics or those intended for print, Adobe InDesign is an excellent choice. It offers:
- Master Pages: Ensures consistency across multiple pages.
- Advanced Layout Tools: Helps in organizing complex information.
- Export Options: Supports high-quality PDFs for professional printing.
Comparing Adobe Programs for Infographic Creation
When deciding between Adobe programs, consider the following:
- Illustrator: Best for vector-based, scalable designs.
- Photoshop: Ideal for adding detailed raster elements.
- InDesign: Perfect for multi-page or print-ready infographics.
Frequently Asked Questions (FAQ)
What are the best tools for creating infographics?
There are several excellent tools available for creating infographics, catering to different skill levels and needs. Some of the most popular options include Canva, which is user-friendly and offers a wide range of templates, and Piktochart, known for its intuitive interface and customization options. For more advanced users, Adobe Illustrator provides unparalleled flexibility and precision, while Venngage is great for those looking to create professional-looking infographics quickly. Each tool has its strengths, so the best choice depends on your specific requirements and expertise.
Are there free tools for creating infographics?
Yes, there are several free tools that allow you to create high-quality infographics without spending money. Canva offers a free version with a vast library of templates and design elements, making it a popular choice for beginners. Piktochart also provides a free plan with basic features, which is sufficient for creating simple infographics. Additionally, Visme and Easel.ly offer free options with limited functionality, but they are still powerful enough to produce visually appealing designs. These tools are ideal for individuals or small businesses with budget constraints.
What features should I look for in an infographic tool?
When choosing an infographic tool, consider features like ease of use, template variety, and customization options. A good tool should offer a wide range of templates to suit different topics and styles, as well as the ability to customize colors, fonts, and layouts. Data visualization capabilities are also crucial, as they allow you to present complex information in an engaging way. Additionally, look for tools that support collaboration if you're working with a team, and ensure the platform allows for easy exporting and sharing of your final design.
Can I create infographics without design experience?
Absolutely! Many infographic tools are designed with beginners in mind, offering drag-and-drop interfaces and pre-designed templates that make the process straightforward. Canva and Piktochart are particularly beginner-friendly, providing step-by-step guidance and a wide array of design elements. These tools eliminate the need for advanced design skills, allowing anyone to create professional-looking infographics. With a bit of practice, even those with no prior experience can produce visually compelling and informative designs.
Leave a Reply
Articles of interest