? 2")
- How to Share Weekly Marketing Metrics Effectively Without Overwhelming Your Team
- What is the most important metric to track in marketing?
- Why are marketing metrics important?
-
Which metric is the most important metric with regards to content marketing?
- Why is Engagement Rate a Critical Metric in Content Marketing?
- How Does Conversion Rate Impact Content Marketing Success?
- Why is Traffic Volume Important for Content Marketing?
- What Role Does Bounce Rate Play in Content Marketing?
- How Does Customer Retention Rate Reflect Content Marketing Effectiveness?
- What are the three most commonly used measures of marketing performance?
- Frequently Asked Questions from Our Community
Sharing weekly marketing metrics effectively requires a balance between providing valuable insights and avoiding information overload. Teams rely on these updates to gauge performance, make informed decisions, and align strategies. However, presenting too much data or using overly complex formats can overwhelm stakeholders, leading to disengagement or misinterpretation. The key lies in focusing on the most relevant metrics, tailoring the presentation to the audience, and using clear, concise visuals. By prioritizing clarity and context, marketers can ensure their reports are both actionable and easy to digest. This article explores practical tips for sharing weekly marketing metrics in a way that is helpful, insightful, and not overwhelming.
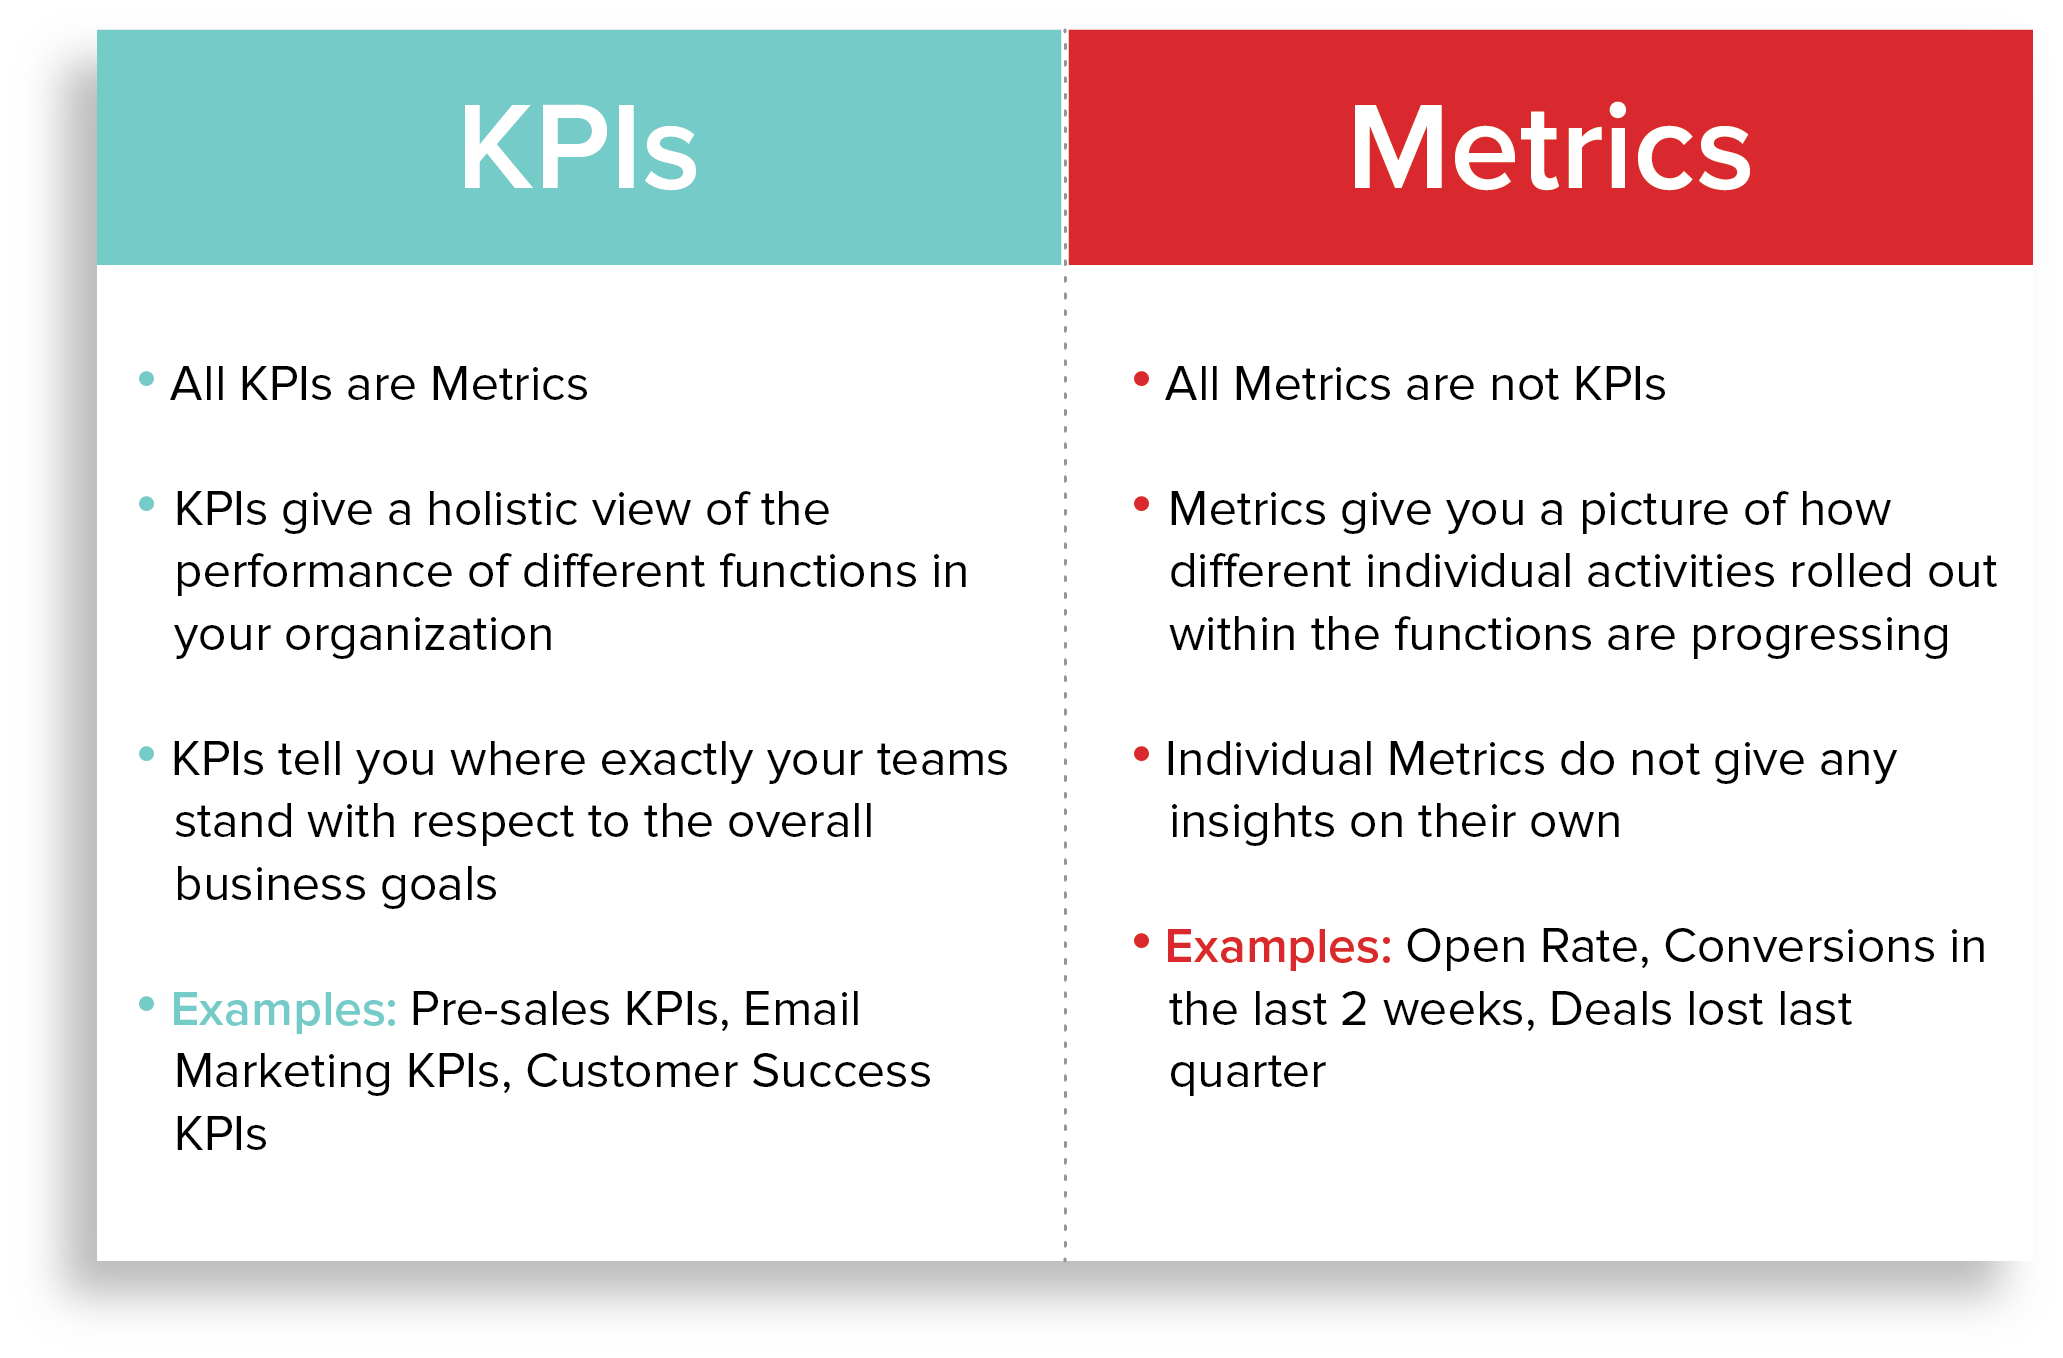
1. Focus on Key Performance Indicators (KPIs)
When sharing weekly marketing metrics, it's crucial to focus on the most relevant KPIs that align with your team's goals. Avoid bombarding your audience with too much data. Instead, highlight metrics like conversion rates, click-through rates (CTR), and return on ad spend (ROAS). This ensures the information is actionable and easy to digest.
See Also KPIs and how to measure success?
| KPI | Why It Matters |
|---|---|
| Conversion Rate | Shows the effectiveness of your campaigns in driving actions. |
| CTR | Indicates how engaging your ads or content are. |
| ROAS | Measures the profitability of your marketing efforts. |
2. Use Visuals to Simplify Data
Visual aids like charts, graphs, and dashboards can make complex data more accessible. Tools like Google Data Studio or Tableau can help you present metrics in a visually appealing way. This approach helps your team quickly grasp trends and insights without getting lost in numbers.
| Visual Tool | Benefit |
|---|---|
| Bar Charts | Great for comparing performance across campaigns. |
| Line Graphs | Ideal for showing trends over time. |
| Pie Charts | Useful for displaying proportions, like traffic sources. |
3. Provide Context for the Metrics
Simply presenting numbers isn't enough. Always include context to explain what the data means. For example, if your CTR dropped, explain potential reasons like seasonal trends or ad fatigue. This helps your team understand the why behind the numbers.
See Also What strategies have you used to increase email open rates?
| Metric | Context Example |
|---|---|
| CTR Drop | Could be due to ad fatigue or a less engaging audience. |
| Conversion Rate Increase | Might result from a successful A/B test or improved targeting. |
4. Tailor the Report to Your Audience
Different stakeholders need different levels of detail. For executives, focus on high-level insights like overall performance and ROI. For marketing teams, dive deeper into campaign-specific metrics and optimization opportunities. Customizing your report ensures it’s relevant and useful for everyone.
| Audience | Focus Area |
|---|---|
| Executives | High-level performance and ROI. |
| Marketing Teams | Campaign-specific metrics and optimization. |
5. Keep It Consistent and Actionable
Consistency is key when sharing weekly metrics. Use the same format and structure each week to make it easier for your team to follow. Additionally, always include actionable recommendations based on the data. For example, if engagement is low, suggest testing new content formats or adjusting targeting strategies.
See Also Generalist vs. Specialist – Which Is Better in the Long Run for Marketing?
| Consistency Tip | Actionable Insight |
|---|---|
| Same Report Format | Helps the team quickly locate key information. |
| Include Recommendations | Encourages immediate action and improvement. |
What is the most important metric to track in marketing?
The most important metric to track in marketing is Return on Investment (ROI). ROI measures the profitability of your marketing efforts by comparing the revenue generated to the costs incurred. It provides a clear picture of whether your campaigns are delivering value and helps in making data-driven decisions. Tracking ROI ensures that resources are allocated efficiently and that marketing strategies are aligned with business goals.
Why is ROI the most critical marketing metric?
ROI is the most critical marketing metric because it directly ties marketing efforts to financial outcomes. Here’s why:
See Also Affordable & Reputable Online Programs for Master's in Marketing?
- Measures profitability: It shows how much revenue is generated for every dollar spent on marketing.
- Guides decision-making: Helps identify which campaigns are worth investing in and which need improvement.
- Aligns with business goals: Ensures marketing strategies contribute to overall business growth and profitability.
How to calculate ROI in marketing?
Calculating ROI in marketing involves a straightforward formula:
- Subtract marketing costs from revenue: Determine the net profit generated by the campaign.
- Divide by marketing costs: This gives the ROI as a percentage.
- Example: If a campaign generates $10,000 in revenue and costs $2,000, the ROI is (($10,000 - $2,000) / $2,000) 100 = 400%.
What are the challenges of tracking ROI?
Tracking ROI in marketing can be challenging due to several factors:
See Also How to Promote My Courses via Instagram?
- Attribution complexity: Determining which marketing efforts directly led to conversions can be difficult.
- Long sales cycles: In industries with extended sales cycles, it may take time to see the full impact of campaigns.
- Data accuracy: Incomplete or inaccurate data can skew ROI calculations.
What other metrics complement ROI in marketing?
While ROI is crucial, other metrics provide additional insights into marketing performance:
- Customer Acquisition Cost (CAC): Measures the cost of acquiring a new customer.
- Customer Lifetime Value (CLV): Estimates the total revenue a customer will generate over their lifetime.
- Conversion Rate: Tracks the percentage of leads that convert into customers.
How to improve ROI in marketing campaigns?
Improving ROI in marketing campaigns requires a strategic approach:
- Optimize targeting: Focus on reaching the right audience to reduce wasted ad spend.
- Test and refine: Use A/B testing to identify the most effective messaging and creatives.
- Leverage automation: Use tools to streamline processes and reduce manual effort.
Why are marketing metrics important?
Why Are Marketing Metrics Important for Decision-Making?
Marketing metrics are crucial for informed decision-making because they provide actionable insights into the effectiveness of marketing strategies. By analyzing these metrics, businesses can identify what works and what doesn’t, allowing them to allocate resources more efficiently. Key reasons include:
- Data-driven decisions: Metrics eliminate guesswork and enable decisions based on real-time data.
- Resource optimization: Helps in identifying high-performing campaigns to focus on.
- Performance tracking: Allows businesses to measure progress toward specific goals.
How Do Marketing Metrics Improve ROI?
Marketing metrics directly impact Return on Investment (ROI) by highlighting which strategies generate the most revenue. By tracking metrics like cost per lead, customer acquisition cost, and conversion rates, businesses can refine their efforts to maximize profitability. Key points include:
- Cost efficiency: Identifies areas where spending can be reduced without sacrificing results.
- Revenue growth: Pinpoints campaigns that drive the highest revenue.
- Budget allocation: Ensures funds are directed toward the most effective channels.
What Role Do Marketing Metrics Play in Customer Insights?
Marketing metrics provide valuable insights into customer behavior and preferences, enabling businesses to tailor their strategies to meet customer needs. Metrics like customer lifetime value, churn rate, and engagement rates help in understanding the audience better. Key aspects include:
- Personalization: Helps in creating targeted campaigns that resonate with specific customer segments.
- Retention strategies: Identifies patterns that lead to customer churn and ways to prevent it.
- Customer satisfaction: Measures how well marketing efforts align with customer expectations.
How Do Marketing Metrics Enhance Campaign Performance?
Marketing metrics are essential for optimizing campaign performance by providing a clear picture of what’s working and what’s not. Metrics such as click-through rates, bounce rates, and social media engagement help in refining campaigns for better results. Key benefits include:
- Real-time adjustments: Allows marketers to tweak campaigns on the fly for better outcomes.
- Benchmarking: Provides a standard to compare current performance against past campaigns.
- Goal alignment: Ensures campaigns are aligned with broader business objectives.
Why Are Marketing Metrics Critical for Competitive Advantage?
Marketing metrics provide a competitive edge by enabling businesses to stay ahead of industry trends and outperform competitors. By analyzing metrics like market share, brand awareness, and customer sentiment, companies can identify opportunities and threats. Key points include:
- Market positioning: Helps in understanding where the brand stands relative to competitors.
- Trend identification: Enables businesses to adapt quickly to changing market conditions.
- Innovation opportunities: Highlights gaps in the market that can be exploited for growth.
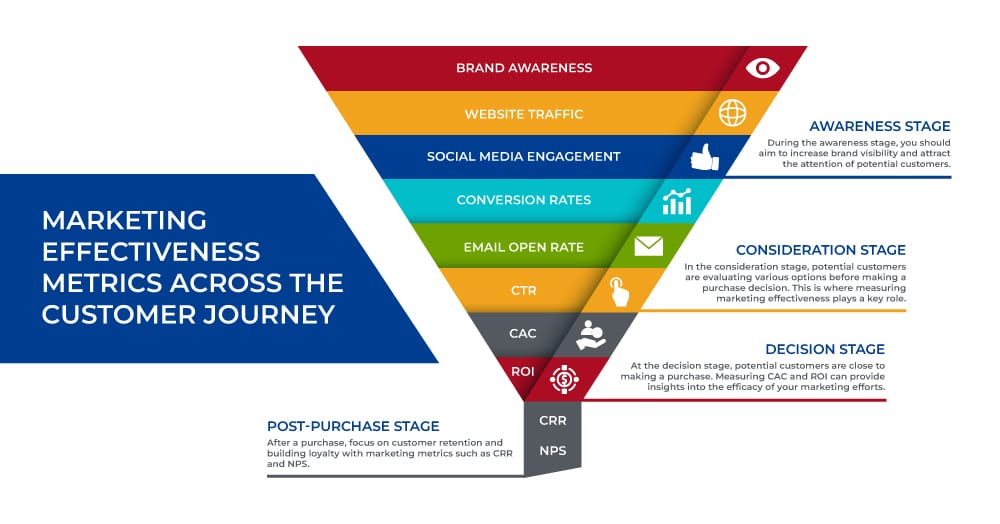
Which metric is the most important metric with regards to content marketing?
Why is Engagement Rate a Critical Metric in Content Marketing?
The engagement rate is one of the most important metrics in content marketing because it measures how actively your audience interacts with your content. High engagement indicates that your content resonates with your audience, which can lead to increased brand loyalty and conversions. Key factors to consider include:
- Likes, comments, and shares show how well your content is being received.
- Time spent on page reflects the depth of interest in your content.
- Click-through rates (CTR) demonstrate how effectively your content drives action.
How Does Conversion Rate Impact Content Marketing Success?
The conversion rate is a vital metric as it directly ties content performance to business outcomes. It measures how effectively your content turns readers into customers or leads. Important aspects to analyze include:
- Lead generation from gated content like eBooks or webinars.
- Sales conversions driven by product-focused content.
- Sign-ups or subscriptions resulting from compelling calls-to-action (CTAs).
Why is Traffic Volume Important for Content Marketing?
Traffic volume is a foundational metric that indicates how many people are viewing your content. While it doesn’t measure quality directly, it provides insights into your content’s reach. Key considerations include:
- Organic traffic from search engines shows SEO effectiveness.
- Referral traffic highlights partnerships or backlinks.
- Direct traffic reflects brand recognition and loyalty.
What Role Does Bounce Rate Play in Content Marketing?
The bounce rate measures the percentage of visitors who leave your site after viewing only one page. A high bounce rate may indicate that your content isn’t engaging or relevant. Factors to evaluate include:
- Content relevance to the target audience.
- Page load speed and user experience.
- Clear navigation and internal linking strategies.
How Does Customer Retention Rate Reflect Content Marketing Effectiveness?
The customer retention rate measures how well your content keeps existing customers engaged and loyal. High retention rates often correlate with effective content strategies. Key elements to focus on include:
- Educational content that adds value over time.
- Personalized content tailored to customer preferences.
- Regular updates and follow-ups to maintain interest.
What are the three most commonly used measures of marketing performance?
Return on Investment (ROI)
Return on Investment (ROI) is one of the most critical measures of marketing performance. It calculates the profitability of marketing campaigns by comparing the revenue generated to the costs incurred. A high ROI indicates that the marketing efforts are effective and generating significant returns. Key factors to consider when measuring ROI include:
- Revenue generated from the marketing campaign.
- Costs associated with the campaign, including ad spend, labor, and tools.
- Net profit after deducting expenses from revenue.
Customer Acquisition Cost (CAC)
Customer Acquisition Cost (CAC) measures the total cost of acquiring a new customer. This metric helps businesses understand how much they are spending to attract each customer and whether their marketing strategies are cost-effective. To calculate CAC, consider the following:
- Total marketing and sales expenses over a specific period.
- Number of new customers acquired during that period.
- Divide total expenses by the number of new customers to determine CAC.
Conversion Rate
Conversion Rate is a key metric that measures the percentage of users who take a desired action, such as making a purchase or signing up for a newsletter. It reflects the effectiveness of marketing campaigns in driving user engagement. To improve conversion rates, focus on:
- Optimizing landing pages for better user experience.
- Creating compelling calls-to-action (CTAs) that encourage users to act.
- Analyzing user behavior to identify and address barriers to conversion.
Customer Lifetime Value (CLV)
Customer Lifetime Value (CLV) estimates the total revenue a business can expect from a single customer over the duration of their relationship. This metric helps in understanding the long-term value of marketing efforts. To calculate CLV, consider:
- Average purchase value per customer.
- Purchase frequency over a specific period.
- Customer lifespan, or the average duration of the customer relationship.
Engagement Metrics
Engagement Metrics track how users interact with marketing content, such as social media posts, emails, or website pages. These metrics provide insights into the effectiveness of content in capturing audience attention. Key engagement metrics include:
- Click-through rate (CTR), which measures the percentage of users who click on a link.
- Time spent on page, indicating how long users engage with content.
- Social media interactions, such as likes, shares, and comments.
Frequently Asked Questions from Our Community
What is the best way to structure weekly marketing metrics reports?
When sharing weekly marketing metrics, it's crucial to structure the report in a way that is both informative and digestible. Start with a brief executive summary that highlights the key takeaways, such as significant changes or achievements. Follow this with a detailed breakdown of the metrics, organized by category (e.g., social media, email campaigns, website traffic). Use visual aids like charts and graphs to make the data more accessible. Finally, include a conclusion or recommendations section to guide the next steps.
To ensure the metrics you share are relevant, it's important to understand your audience's needs and priorities. Tailor the report to focus on the metrics that align with their goals and responsibilities. For example, if your audience is primarily interested in lead generation, emphasize metrics like conversion rates and cost per lead. Avoid overwhelming them with data that doesn't directly impact their decision-making process. Regularly solicit feedback to refine the report's focus over time.
What tools can I use to simplify the process of sharing weekly marketing metrics?
There are several tools available to simplify the process of sharing weekly marketing metrics. Platforms like Google Data Studio, Tableau, and HubSpot allow you to create automated dashboards that update in real-time. These tools can help you visualize data effectively and reduce the time spent on manual reporting. Additionally, consider using collaboration tools like Slack or Microsoft Teams to share updates and discuss insights with your team in a centralized location.
How can I make my weekly marketing metrics report actionable?
To make your weekly marketing metrics report actionable, focus on providing context and insights rather than just presenting raw data. Highlight trends and anomalies that require attention, and suggest specific actions to address them. For example, if you notice a drop in email open rates, recommend testing different subject lines or send times. Including a call-to-action in your report ensures that the data leads to meaningful improvements in your marketing strategy.
Leave a Reply
Articles of interest