
When analyzing Facebook performance for monthly reports, understanding whether to focus on average or total reach is crucial for accurate insights. Reach measures how many unique users see your content, but the choice between average and total reach depends on your reporting goals. Average reach provides a consistent benchmark, showing typical engagement levels over time. In contrast, total reach offers a cumulative view, reflecting the overall impact of your content during the reporting period. Deciding which metric to prioritize can influence how you assess campaign effectiveness and allocate resources. This article explores the differences, benefits, and best use cases for both metrics in monthly reporting.
Understanding Average vs. Total Facebook Reach for Monthly Reports
When analyzing Facebook performance for monthly reports, it's crucial to understand the difference between average reach and total reach. Both metrics provide valuable insights but serve different purposes. Average reach refers to the mean number of unique users who saw your content over a specific period, while total reach represents the cumulative number of unique users who encountered your content during that time. Choosing the right metric depends on your reporting goals and the depth of analysis required.
See Also What's Your Salary as a Marketing Manager/Senior Marketing Manager?
What is Facebook Reach?
Facebook reach measures the number of unique users who have seen your content. It is a key metric for understanding how far your posts, ads, or page updates are spreading. Unlike impressions, which count every view (including multiple views by the same user), reach focuses on unique individuals. This makes it a more accurate indicator of your content's visibility.
| Metric | Definition |
|---|---|
| Reach | Unique users who saw your content |
| Impressions | Total number of times your content was displayed |
Average Reach: When to Use It
Average reach is calculated by dividing the total reach by the number of posts or days in the reporting period. This metric is useful for understanding the typical performance of your content. For example, if your average reach is consistently low, it may indicate that your posts are not resonating with your audience or that your targeting needs adjustment.
See Also What's your favorite client portal software?
| Scenario | Use Average Reach |
|---|---|
| Evaluating content consistency | Yes |
| Comparing performance over time | Yes |
Total Reach: When to Use It
Total reach provides a broader view of your content's overall impact. It is particularly useful for campaigns or periods where you want to measure the cumulative effect of multiple posts. For instance, if you ran a week-long campaign, total reach would show how many unique users were exposed to your content during that time.
| Scenario | Use Total Reach |
|---|---|
| Campaign performance analysis | Yes |
| Monthly or quarterly reporting | Yes |
How to Calculate Average and Total Reach
To calculate average reach, divide the total reach by the number of posts or days. For total reach, simply sum up the unique users reached by each post or ad. Facebook Insights and other analytics tools can automate these calculations, but understanding the process helps you interpret the data more effectively.
See Also Need Some Ideas for My Marketing Project
| Metric | Calculation |
|---|---|
| Average Reach | Total Reach / Number of Posts or Days |
| Total Reach | Sum of Unique Users Reached |
Key Factors Affecting Facebook Reach
Several factors influence your Facebook reach, including content quality, posting frequency, audience targeting, and algorithm changes. High-quality, engaging content is more likely to be shared and seen by a larger audience. Additionally, posting at optimal times and using precise targeting can significantly boost your reach.
| Factor | Impact on Reach |
|---|---|
| Content Quality | High |
| Posting Frequency | Moderate |
| Audience Targeting | High |
Best Practices for Reporting Facebook Reach
When creating monthly reports, it's essential to include both average and total reach to provide a comprehensive view of your performance. Use visual aids like graphs and charts to make the data more digestible. Additionally, compare your reach metrics to previous periods to identify trends and areas for improvement.
| Practice | Benefit |
|---|---|
| Include both metrics | Comprehensive analysis |
| Use visual aids | Improved readability |
| Compare with past data | Identify trends |
What is a good monthly reach on Facebook?

What Defines a Good Monthly Reach on Facebook?
A good monthly reach on Facebook depends on several factors, including the size of your audience, your industry, and your marketing goals. For small businesses or niche markets, reaching 10,000 to 50,000 users monthly might be considered successful. Larger brands or those with broader audiences often aim for hundreds of thousands or even millions of monthly reach. Key considerations include:
- Audience size: A larger follower base naturally leads to higher reach.
- Engagement rate: Higher engagement can amplify your reach organically.
- Content quality: Shareable and engaging content increases visibility.
How to Measure Your Facebook Monthly Reach
Measuring your Facebook monthly reach is essential to understand your performance. Use Facebook Insights to track metrics such as:
- Organic reach: The number of unique users who saw your content without paid promotion.
- Paid reach: The number of users reached through ads or boosted posts.
- Viral reach: The number of users who saw your content because someone interacted with it.
Factors That Influence Facebook Monthly Reach
Several factors can impact your Facebook monthly reach, including:
- Algorithm changes: Facebook's algorithm prioritizes certain types of content, affecting reach.
- Posting frequency: Consistent posting can help maintain or increase reach.
- Audience activity: Posting when your audience is most active improves visibility.
Strategies to Increase Your Facebook Monthly Reach
To boost your Facebook monthly reach, consider implementing the following strategies:
- Use engaging visuals: Images and videos tend to perform better than text-only posts.
- Leverage Facebook Groups: Sharing content in relevant groups can expand your reach.
- Collaborate with influencers: Partnering with influencers can expose your content to a wider audience.
Comparing Organic vs. Paid Reach on Facebook
Understanding the difference between organic and paid reach is crucial for optimizing your Facebook strategy:
- Organic reach: Achieved without spending money, relying on content quality and engagement.
- Paid reach: Achieved through ads, allowing you to target specific demographics.
- Combined approach: Using both organic and paid strategies often yields the best results.
What is considered a good reach rate?
What is a Reach Rate in Marketing?
The reach rate is a metric used to measure the percentage of your target audience that has seen your content or advertisement. It is calculated by dividing the number of unique viewers by the total size of your target audience and multiplying by 100. A good reach rate indicates that your content is effectively penetrating your intended audience.
- Definition: Reach rate measures the percentage of your audience exposed to your content.
- Calculation: (Unique viewers / Total audience size) 100.
- Importance: Helps evaluate the effectiveness of your marketing campaigns.
What Factors Influence a Good Reach Rate?
Several factors can influence what is considered a good reach rate, including the platform used, the type of content, and the audience demographics. For example, social media platforms like Instagram or Facebook may have different benchmarks compared to email marketing campaigns.
- Platform: Different platforms have varying audience engagement levels.
- Content Type: Videos, images, and text posts may perform differently.
- Audience Demographics: Age, location, and interests affect reach.
On social media, a good reach rate typically ranges between 10% and 30%, depending on the platform and industry. For instance, Facebook might have a lower reach rate due to algorithm changes, while Instagram could yield higher rates due to its visual nature.
- Facebook: 5% to 10% is considered decent.
- Instagram: 15% to 30% is often seen as good.
- LinkedIn: 2% to 5% is standard for professional content.
How Does Reach Rate Differ Across Industries?
The definition of a good reach rate can vary significantly across industries. For example, the entertainment industry might achieve higher reach rates due to viral content, while niche industries like B2B services may have lower but more targeted reach rates.
- Entertainment: High reach rates due to viral potential.
- B2B Services: Lower reach rates but highly targeted.
- E-commerce: Moderate reach rates with seasonal spikes.
How to Improve Your Reach Rate?
Improving your reach rate involves optimizing your content strategy, leveraging analytics, and engaging with your audience. Using hashtags, posting at optimal times, and creating shareable content are some effective methods.
- Optimize Posting Times: Post when your audience is most active.
- Use Hashtags: Increase visibility with relevant hashtags.
- Engage with Followers: Respond to comments and messages to boost interaction.
How to calculate average reach on Facebook?

Understanding Facebook Reach Metrics
To calculate the average reach on Facebook, you first need to understand what reach means. Reach refers to the number of unique users who have seen your content. Facebook provides reach metrics in its analytics tools, such as Facebook Insights or Ads Manager. These tools break down reach into categories like organic reach, paid reach, and viral reach. By analyzing these metrics, you can determine how effectively your content is being distributed and viewed by your audience.
- Organic Reach: The number of unique users who saw your content without paid promotion.
- Paid Reach: The number of unique users who saw your content through paid advertisements.
- Viral Reach: The number of unique users who saw your content because someone interacted with it (e.g., shared or commented).
Steps to Calculate Average Reach on Facebook
Calculating the average reach involves gathering data over a specific period and performing a simple calculation. Follow these steps to determine your average reach:
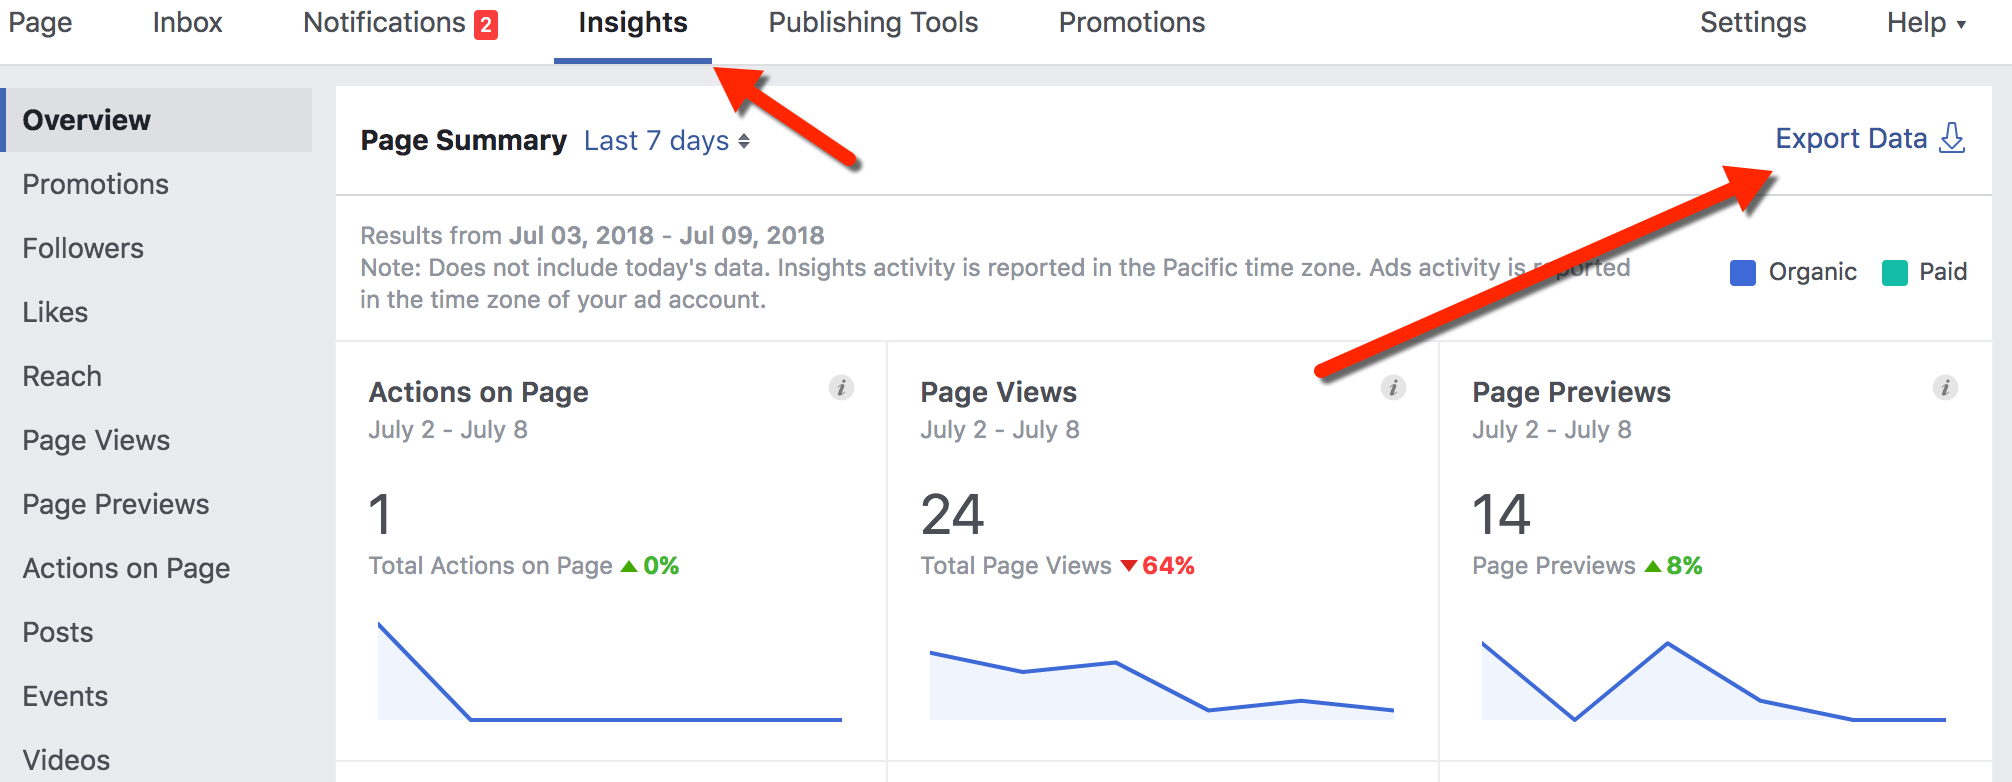
- Access Facebook Insights: Go to your Facebook Page and navigate to the Insights tab.
- Select a Time Frame: Choose the period for which you want to calculate the average reach (e.g., 7 days, 30 days).
- Gather Reach Data: Note the total reach for each day or post within the selected time frame.
- Sum the Reach: Add up the total reach for all days or posts.
- Divide by the Number of Days or Posts: Divide the total reach by the number of days or posts to get the average reach.
Using Facebook Ads Manager for Reach Calculation
If you are running paid campaigns, Facebook Ads Manager is a powerful tool to calculate average reach. It provides detailed insights into how your ads are performing and who they are reaching. Here’s how to use it:
- Open Ads Manager: Log in to your Facebook Ads Manager account.
- Select Your Campaign: Choose the campaign for which you want to calculate reach.
- View Reach Metrics: Look at the Reach column to see the number of unique users who saw your ad.
- Calculate Average Reach: Sum the reach for all ads in the campaign and divide by the number of ads or days.
Analyzing Reach Trends Over Time
To gain deeper insights, analyze how your average reach changes over time. This helps identify patterns, such as seasonal fluctuations or the impact of specific campaigns. Use the following steps:
- Export Data: Export reach data from Facebook Insights or Ads Manager.
- Create a Spreadsheet: Organize the data in a spreadsheet to track daily or weekly reach.
- Plot a Graph: Visualize the data using a line graph to observe trends.
- Identify Patterns: Look for consistent increases or decreases in reach and correlate them with your activities.
Improving Your Average Reach on Facebook
Once you’ve calculated your average reach, you can take steps to improve it. Here are some strategies to increase your reach:
- Optimize Posting Times: Share content when your audience is most active.
- Use Engaging Content: Create posts that encourage likes, shares, and comments to boost organic reach.
- Leverage Paid Ads: Invest in targeted Facebook ads to expand your reach to new audiences.
- Collaborate with Influencers: Partner with influencers to tap into their follower base.
- Analyze Competitors: Study what works for competitors and adapt similar strategies.
What is total reach on Facebook?
What is Total Reach on Facebook?
Total Reach on Facebook refers to the total number of unique users who have seen any content associated with your Facebook Page, including posts, ads, or stories, within a specific time frame. It is a key metric that helps you understand the overall visibility of your content and how many people it has potentially impacted. This metric includes both organic reach (unpaid content) and paid reach (sponsored content).
- Organic Reach: The number of unique users who saw your content without any paid promotion.
- Paid Reach: The number of unique users who saw your content as a result of paid advertising.
- Viral Reach: The number of unique users who saw your content because it was shared by others.
Why is Total Reach Important on Facebook?
Total Reach is a critical metric because it provides insights into the effectiveness of your content strategy and how well your brand is resonating with your audience. A higher reach indicates that your content is being seen by more people, which can lead to increased engagement, brand awareness, and potential conversions.
- Brand Awareness: A higher reach means more people are exposed to your brand.
- Engagement Potential: Increased reach often correlates with higher engagement rates.
- Campaign Effectiveness: Helps evaluate the success of both organic and paid campaigns.
How is Total Reach Calculated on Facebook?
Total Reach is calculated by Facebook by combining the number of unique users who have seen your organic content, paid content, and viral content. It eliminates duplicate views, ensuring that each user is only counted once, regardless of how many times they interact with your content.
- Unique Users: Each user is counted only once, even if they see multiple pieces of content.
- Combined Metrics: Includes organic, paid, and viral reach.
- Time Frame: Measured over a specific period, such as daily, weekly, or monthly.
What Factors Influence Total Reach on Facebook?
Several factors can influence your Total Reach on Facebook, including the quality of your content, the timing of your posts, your audience size, and the effectiveness of your paid campaigns. Understanding these factors can help you optimize your strategy to maximize reach.
- Content Quality: Engaging and relevant content is more likely to be shared and seen by more users.
- Post Timing: Posting when your audience is most active can increase visibility.
- Audience Size: A larger follower base naturally increases potential reach.
How to Improve Total Reach on Facebook?
Improving your Total Reach on Facebook requires a combination of strategic content creation, audience engagement, and effective use of paid promotions. By focusing on these areas, you can increase the visibility of your content and grow your audience.
- Create Engaging Content: Use visuals, videos, and compelling captions to capture attention.
- Leverage Facebook Ads: Invest in targeted ad campaigns to expand your reach.
- Encourage Sharing: Ask your audience to share your content to increase viral reach.
Frequently Asked Questions from Our Community
What is the difference between average and total Facebook reach in a monthly report?
Average Facebook reach refers to the mean number of unique users who saw your content over a specific period, such as a month. It provides an idea of the typical audience size for your posts. On the other hand, total Facebook reach represents the cumulative number of unique users who saw your content during the same period. While average reach gives you a sense of consistency, total reach shows the overall impact of your content throughout the month.
Why is it important to track both average and total Facebook reach?
Tracking both average reach and total reach is crucial for understanding the effectiveness of your Facebook strategy. Average reach helps you gauge the consistency of your content's visibility, while total reach provides insight into the overall exposure your brand achieved. Together, these metrics help you identify trends, such as whether your content is consistently engaging or if certain posts significantly boosted your visibility.
How can I calculate average Facebook reach for a monthly report?
To calculate average Facebook reach, sum the daily or weekly reach numbers for the month and divide by the number of days or weeks in that period. For example, if your total reach for the month is 30,000 and the month has 30 days, your average daily reach would be 1,000. This calculation helps you understand the typical performance of your content and compare it across different timeframes.
What factors can influence total Facebook reach in a monthly report?
Several factors can impact your total Facebook reach, including the frequency of your posts, the quality of your content, and the level of engagement it generates. Additionally, factors like algorithm changes, paid promotions, and seasonal trends can also play a role. Monitoring these variables alongside your reach metrics can help you optimize your strategy to maximize visibility and engagement.
Leave a Reply
Articles of interest